


SMS marketing statistics are useful only when the metric, audience, message type, and denominator are clear. This 2026 roundup uses current public data and real experiments to separate channel reach from delivery, response, and business results, while flagging popular figures that standard SMS cannot measure directly.
For businesses, SMS marketing means permission-based text messages sent for a defined commercial or customer-communication purpose. The channel reaches ordinary mobile phones, but no single open-rate, response-rate, or ROI benchmark describes every alert, reminder, offer, audience, and sending route.
SMS marketing statistics in a nutshell
- Pew Research Center found that 98% of U.S. adults owned a cellphone and 91% owned a smartphone in its 2025 survey.
- Americans exchanged nearly 2.2 trillion SMS and MMS messages in 2024, according to CTIA’s 2025 Annual Survey.
- Standard SMS does not provide a protocol-level read receipt, so a universal SMS open rate cannot be read directly from the channel.
- Experiments show that text can accelerate an action, but the final response depends on the audience, message, timing, and comparison channel.
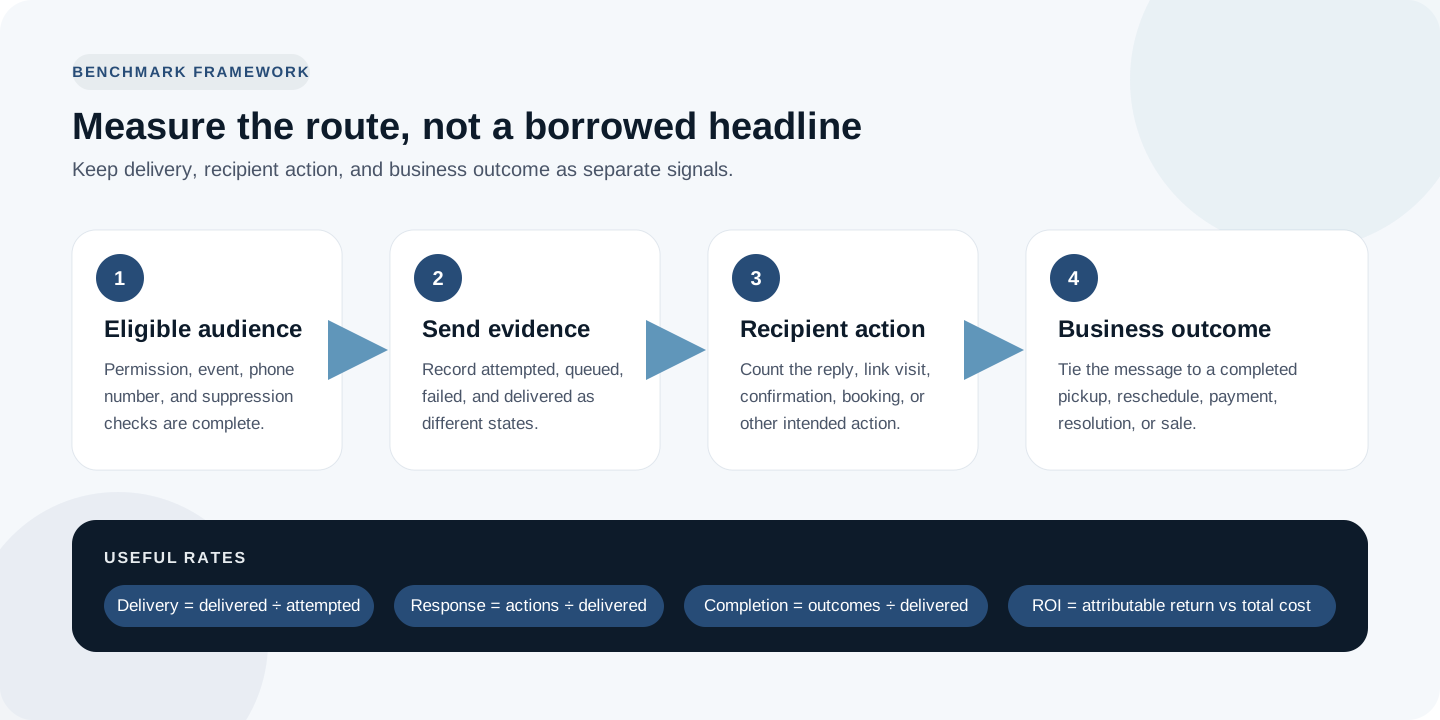
- Build benchmarks from attempted sends, delivery evidence, replies or actions, and completed business outcomes instead of borrowing one headline percentage.
Want the measurement plan to start with the actual workflow? Review the VoxiSMS integrations directory and choose the system that already records the trigger and result.
Twelve SMS marketing statistics and findings worth using in 2026
These findings are not interchangeable benchmarks. Each one describes a specific population, year, experiment, or measurement method.
| Sourced finding | What it measures | Practical reading |
|---|---|---|
| 98% of U.S. adults owned a cellphone and 91% owned a smartphone in a survey of 5,022 adults conducted in 2025. Source: Pew Research Center | Potential device reach in the United States | SMS does not require the recipient to install a new business app, but ownership is not permission or intent. |
| Americans exchanged nearly 2.2 trillion SMS and MMS messages in 2024. Source: CTIA, page 8 | U.S. network usage | Texting remains a large, active communication channel. This total combines person-to-person and business traffic, SMS and MMS. |
| The same CTIA survey reported nearly 42 billion more SMS and MMS messages in 2024 than in 2023. Source: CTIA, page 8 | Year-over-year message-volume change | Aggregate traffic rose, but the figure does not reveal marketing performance. |
| FCC robotext complaints rose from about 3,300 in 2015 to 18,900 in 2022, an increase of more than 500%. Source: FCC report to Congress, page 10 | Complaint volume about unwanted robotexts | Permission, sender recognition, and message relevance affect channel trust. The complaint count is not a measure of legitimate business texting. |
| Apple states that read receipts are not supported with SMS messaging. Source: Apple Messages guidance | What standard SMS can report | Delivery and opening are different events. A claimed SMS open rate needs a separate research method rather than a delivery log. |
| In a Pew experiment, 15% of the text-plus-email group opened a survey in the first 30 minutes, compared with 6% of the email-only group. Source: Pew Research Center | Early action among consenting survey panelists | A text notification can change response speed in a defined task. It does not establish a general marketing open rate. |
| By the end of the first full day in that experiment, 50% of the text-plus-email group had responded, compared with 37% of the email-only group. Source: Pew Research Center | Short-term response timing | SMS may be useful when the timing of the action matters. |
| After the full 20-day field period, response was 82% for text plus email and 81% for email only. Source: Pew Research Center | Final response after enough time | Faster response and higher final conversion are not the same result. |
| A field experiment with 33,848 telecom customers reported an overall campaign response rate of 0.49%; Table 5 reports 36 SMS responses, or 0.35% for that channel. Source: Electronic Commerce Research and Applications | Purchase response in one short-form advertising campaign | A real campaign can perform far below a recycled “45% response rate.” Audience, offer, and task define the denominator. |
| In a trial of 618 participants, 90% returned a questionnaire after a personalized text prompt, compared with 84% after a standard prompt. Source: Trials | Response to a personalized reminder in a research setting | Personalization helped in this context, but the outcome was a questionnaire return, not a sale. |
| In a separate randomized trial of 591 participants, SMS and email reminders produced no significant difference in completed program sessions: 4.30 versus 4.36 on average. Quit-attempt rates were also not significantly different at 34.2% versus 31.7%. Source: Journal of Medical Internet Research | Adherence and behavior in an online health program | A text is not automatically stronger than email. The task and audience can erase the channel difference. |
| A 2024 systematic review of 25 randomized trials found a small positive effect of text reminders on vaccination uptake, with a pooled risk ratio of 1.09. Source: Vaccines | Reminder effect across healthcare studies | Text reminders can support action, but the result belongs to vaccination outreach and should not be presented as an ecommerce or campaign conversion rate. |
The studies vary by setting and outcome. SMS can reach a broad device base and move some actions earlier, while response and outcome rates still depend on the job the message is asking the recipient to complete.
The popular SMS open-rate claim needs a measurement note
A delivery report can show that a carrier or device accepted a message. It does not prove that the recipient read it. Apple’s current guidance explicitly says that SMS does not support read receipts, while iMessage can provide them when enabled.
That makes the familiar “98% SMS open rate” unsuitable as a universal operational benchmark unless the publisher explains how opens were observed. A panel study, instrumented messaging app, survey, or modeled estimate may produce an open figure, but a normal SMS delivery log cannot.
Use these labels consistently:
| Metric | A defensible denominator | What it can tell you |
|---|---|---|
| Attempt rate | Eligible messages prepared | Whether the workflow reached the send step |
| Delivery rate | Messages delivered ÷ messages attempted | Whether the sending route completed delivery |
| Response rate | Defined replies or actions ÷ delivered messages | Whether recipients completed the immediate requested action |
| Completion rate | Business outcomes ÷ delivered messages | Whether the message contributed to the actual operational goal |
| Opt-out rate | Stop requests ÷ delivered messages | Whether the audience or message is producing withdrawal signals |
Do not rename delivery as open, or a reply as revenue. Keep the stages separate so a change in one part of the workflow does not hide a problem in another.
Response benchmarks depend on the requested action
The studies above do not produce one neat response-rate figure. Teams need benchmarks by use case.
The Pew experiment asked consenting panelists to open and complete a survey. The telecom experiment asked customers to buy mobile credit. The healthcare studies asked people to complete a program or attend for vaccination. Those are different levels of effort, urgency, trust, and prior intent.
Compare like with like:
- appointment confirmations against previous appointment confirmations;
- order-ready replies against previous order-ready messages;
- lead follow-up replies against leads from the same source and offer;
- payment-link completion against the same payment workflow;
- promotional conversions against the same consented audience and attribution window.
If the message changes from “reply C” to “complete a purchase,” the old response benchmark no longer describes the same job.
ROI is a business calculation, not a channel constant
There is no universal SMS ROI that applies across countries, carrier plans, staff costs, attribution rules, offers, and message types. Calculate it from the business outcome and the full cost of the route.
Start with:
SMS ROI = (attributable contribution from the workflow - total workflow cost) ÷ total workflow cost
Total workflow cost can include the sending software, carrier plan, automation tasks, device, setup, monitoring, and staff reply handling. Attributable contribution should use a consistent window and a real business outcome, such as a completed pickup, retained appointment, paid invoice, or sale.
For VoxiSMS, the Android phone sends through the mobile plan already active on the device, and VoxiSMS adds no per-message fee. That changes the cost model, but it does not create a guaranteed return. The workflow still needs a useful trigger, a relevant message, and an outcome the business can observe.

Build an SMS benchmark from your own workflow
My recommendation is to begin with one operational message type and one explicit action. Record the source event, phone number, send state, reply or link action, and business outcome under the same workflow identifier.
Use the VoxiSMS Zapier integration when a straightforward app event should trigger the message. Choose the VoxiSMS Make integration when the scenario needs filters, branches, or mapped data. Appointment teams can use the VoxiSMS and Voxiplan integration for confirmations, reminders, cancellations, and reply routing.
A practical first benchmark can use five fields:
- eligible records;
- attempted sends;
- delivered messages;
- defined recipient actions;
- completed business outcomes.
Review failure reasons and unmatched replies alongside the rate. A percentage can improve because the denominator shrank, so keep the underlying counts visible.
Ready to measure a real route? Install VoxiSMS from Google Play, connect an Android phone, and test one internal workflow before using it with customers.
Frequently asked questions
Is the 98% SMS open rate accurate?
It is not a protocol-level SMS measurement. Standard SMS does not provide a read receipt, so any open-rate claim needs a separate research method and a clearly defined sample. Use delivery, response, and completed actions as distinct metrics in your own workflow.
What is a good SMS response rate?
There is no useful universal number. A confirmation reply, survey completion, purchase, and payment each require different effort. Establish a baseline for one audience, message type, action, and attribution window, then compare future sends against that baseline.
Is SMS always more effective than email?
No. Pew’s survey experiment found faster early responses when SMS accompanied email, but the final response rates converged. Another randomized trial found no significant difference between SMS and email reminders. Choose the channel based on the task and test the actual workflow.
Which SMS marketing metrics should a small business track?
Track eligible records, attempted sends, delivery evidence, defined replies or actions, completed business outcomes, opt-outs, failures, and total cost. Those fields show whether the problem is audience selection, delivery, message design, or the business process after the response.
